

Статьи
аналитические материалы
Gennady Sternik, Andrey Tumanov. House price growth in Russia: the result of housing sector reforms or price bubble?  (ENHR Conference “Shrinking Cities, Sprawling Suburbs, Changing Countrysides”, jul 2008.)
House price growth in Russia: the result of housing sector reforms or price bubble?
Gennadiy Sternik, Plehanov Russian Academy of Economics
Andrey Tumanov, Institute for Urban Economics
Abstract
During last few years Russian housing market experienced a stable price growth (about 20% per year). Unexpectedly in 2006 average increase in prices exceeded 50% while in some regions house prices doubled. Economists and housing experts debate what were the reasons for housing inflation. Could it be a negative effect of housing sector reform, focused on promoting affordable housing, or is it a beginning of housing price bubble?
The article is organized as follows. It begins with a brief overview of legislative initiative in housing sector. We briefly discuss results of implementation of National priority project “Affordable and comfortable housing for Russian citizens”, started in 2006. Next we analyze factors which theoretically cause house price growth and discuss their influence on housing affordability problem in Russia. The presence of highly isolated local housing markets restrain housing mobility and requires in-depth analysis of housing price dynamics. That is why last part of the article describes mathematical model for price forecasting on local housing markets. We use technique of retrospective forecasting for evaluation of model precision and produce forecasts of housing price dynamics in short and middle-term periods. The article concludes with findings and recommendations.
Keywords
Russia, real estate market, mortgage, affordability, price bubble, housing policy
Introduction
In the second half of 90ies the state housing policy of Russia was shaped in accordance with the state target program “Housing”[1] and the Decree “Main agenda of the new phase of implementation of the state target program ‘Housing’”[2]. In 1996-2000 legal and organizational basis of the state housing policies was created, priority tasks were defined and mechanisms of implementation of the state housing policy were finalized. Moreover, the regulatory legal framework was developed, which secured the ownership right in the housing sector and facilitated housing production, housing finance and mortgage lending. Budget role in the housing finance underwent changes: budgets were retargeted at subsidizing housing purchase by citizens.
One of Russia’s current priorities in its social and economic development is the development of an affordable housing market via creating proper conditions for well-balanced growth of effective demand for housing, including the development of residential mortgage lending and the increase of housing construction volume. With this goal in mind, in the end of 2004 the State Duma approved a package of laws, which is widely known as a “package of federal laws on the development of an affordable housing market” including completely new Housing Code, laws aimed at developing mortgage lending, Town Planning Code.
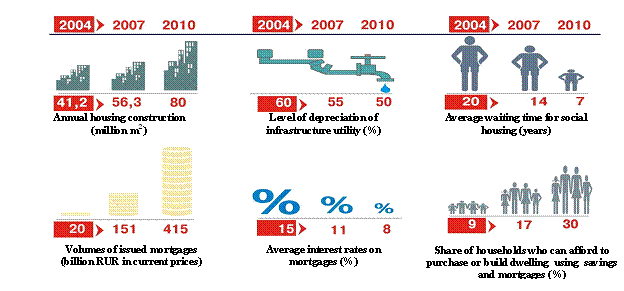
For further implementation of the new federal housing policy in 2005 the President presented a national priority project “Affordable and comfortable housing to Russian citizens” and set up a National Council under the President of the Russian Federation on housing policies, which focuses on the measures aimed at increasing the affordability of home-ownership purchase scheme. The main tool applied for the implementation of the national priority project is the federal target program “Housing” for 2002-2010 and its integral part – subprograms[3] . For the purposes of complying with the target indicators set out in the program (Figure 1) it’s necessary to permanently monitor the housing market, which will allow to substantiate any decision both in quantitative and qualitative terms.
Figure 1. National priority project “Affordable and comfortable housing to Russian citizens”: key indicators for the attainment of the project’s objectives
 One visible consequence
of the implementation of the new housing policy is the housing price growth
throughout the country. Thus, in 2006-2007 in the Russian Federation the real house prices grew on the average by 51% against the figures of
2005, and in 2006 – by 39% against 2005. In Moscow real house price in
2006-2007 grew up by 48% (in 2006 – by 50%, and in 2007 – it fell down by 2%
against 2006); in St. Petersburg – by 43% (in 2006 – by 34%).
One visible consequence
of the implementation of the new housing policy is the housing price growth
throughout the country. Thus, in 2006-2007 in the Russian Federation the real house prices grew on the average by 51% against the figures of
2005, and in 2006 – by 39% against 2005. In Moscow real house price in
2006-2007 grew up by 48% (in 2006 – by 50%, and in 2007 – it fell down by 2%
against 2006); in St. Petersburg – by 43% (in 2006 – by 34%).
In forty regions of the Russian Federation the real house prices over 2 years grew up by more than 50%, in 21 regions – by 25-50%, in 5 regions – by 10-25%, in four – by 0-10%, and in 10 RF regions the real house prices dropped (Figure 2).
Figure 2. Rate of growth of current housing prices in the Russian Federation constituent entities in 2006-2007 (% to 2005)
The size of each segment reflects the share of local population in total RF population
Source: IUE computations based on the data obtained from Rosstat.
In terms of development of housing policies and strategy for increasing the affordability of housing it’s important to identify the reasons behind such a boom in prices and to find out whether it was a price bubble.
The first part of this paper investigates the factors stimulating housing inflation. The second part contains the analysis of the impact of the situation on the housing market on the affordability of housing. And in the third part we verify the hypothesis about the price bubble via analysis of local housing markets in major Russian cities, which analysis is made with the help of mid-term and long-term forecast of price dynamics. And finally, we formulate main conclusions.
Factors of house price growth and affordability of housing
Analysis of factors which determined the growth of housing prices in Russia in 2006-2007 demonstrated that the prices were mostly affected by the increased incomes, which exceeded the effective demand for housing, and by the slowed-down growth of housing supply in the market. The increased effective demand and growth of prices were affected to some extent by other factors, such as boom in residential mortgage lending and high investment attractiveness of housing against the background of lower yield of other financial tools. We analyzed in more detail the impact of 4 factors on the growth of housing prices in 2006-2007: household incomes, residential mortgage lending, budget subsidies for housing purchase, investment behavior in the housing market. In addition, we analyzed whether demand for housing was satisfied or not.
Household incomes
The most important factor, which traditionally affects the housing prices, is the income. High-income households can not only save enough money for housing purchase within a short period of time, but also obtain bank loans for this purpose more easily than households with smaller income. Analysis of data (Figure 3) across RF regions confirms that household incomes affect housing prices.
Figure 3. Average cost of one square meter of housing in primary and secondary markets and average per capita incomes in 2007.
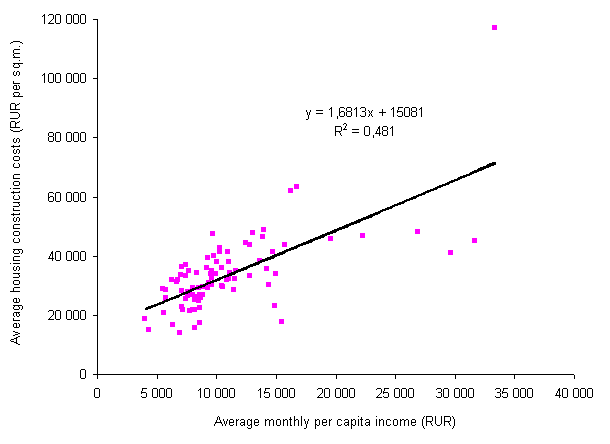
Source: Rosstat
Income growth stimulates the demand for housing. However, if in such situation the market fails to provide adequate growth of housing supply, it leads to the increase in housing prices.
Development of residential mortgage lending
Households can use loans to purchase houses as well as savings.
According to the Central Bank of Russia, the volume of outstanding mortgages increased six fold over 2006-2007. In two regions it was more than 20 times increase over 2006-2007, in ten regions – a 10-20 times increase, in 52 regions – a 5-10 times increase. In other regions the volume of outstanding mortgages increased in 2007 (against 2005) by 2.4-5 times.
It’s a commonly believed that such significant development of residential mortgage lending as nothing else contributed to the growth of house prices in 2006-2007.
Controversially we found that residential mortgage lending most actively is developing in the regions with higher household incomes, which, along with a rather limited supply of quality houses, determine market prices (Figure 4).
However, direct impact of mortgage lending on the growth of demand so far has been not so important due to insignificant share of mortgage transactions in the housing market. According to the Federal Registration Service and the Agency for Housing Mortgage Lending, this share was about 14% in the first half of 2007 (9% in 2006, and 4% in 2005)[4]. In some constituent entities of the RF this share in the first half of 2007 varied between 8% and 19% (Figure 5).
Figure 4. Outstanding residential mortgage balance (per capita), as of January 1, 2008, and average per capita incomes in 2007.

Source: Rosstat, Central Bank of Russia
Figure 5. Proportion of residential mortgage transactions in the Russian housing market.
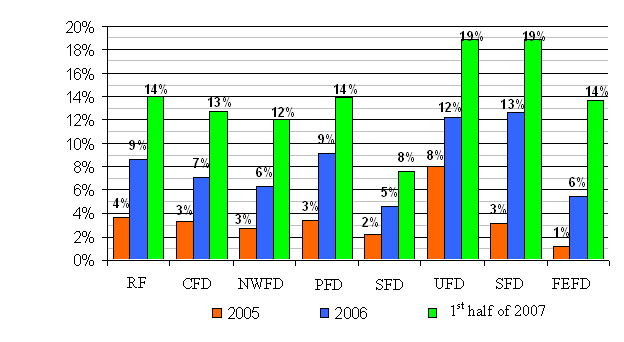 RF – Russian Federation, CFD -
Central Federal District, NWFD - North-West Federal District, PFD -
Privolzhsky Federal District, SFD - Southern Federal District, UFD - Urals
Federal District, SFD - Siberian Federal District, FEFD - Far East Federal
District
RF – Russian Federation, CFD -
Central Federal District, NWFD - North-West Federal District, PFD -
Privolzhsky Federal District, SFD - Southern Federal District, UFD - Urals
Federal District, SFD - Siberian Federal District, FEFD - Far East Federal
District
Source: Agency for Residential Mortgage Lending; Loans Rescheduling: more funds for mortgage lending//Information&Analysis magazine “Perviy Ipotechniy”. 2006, #0, p.11.
Investment demand
Another factor, which affected the growth of effective demand for housing and the growth of housing prices, was the lack of alternative investment opportunities which could ensure both the preservation and extra yield on savings.
Bank deposits and foreign currency were traditionally perceived as the most reliable and convenient way of investing idle funds in Russia. Bank deposits in RUR in 2006-2007 were unable to make profit, because interest on RUR deposits was below the rate of inflation. USD deposits and investment in foreign currency also made no earnings and proved to be loss-making when adjusted for inflation (Table 1).
Table 1. Dynamics of RUR exchange rate in 2004-2006
2004 |
2005 |
2006 |
2007 |
|
Nominal RUR/USD exchange rate Index (% to the previous period) |
-2,6 |
2,5 |
-6,4 |
-6,8 |
Nominal RUR/Euro exchange rate Index (% to the previous period) |
-6,7 |
-6,7 |
1,9 |
3,5 |
Consumer Prices Index (% to the previous period) |
11,7 |
10,9 |
9,0 |
11,9 |
RUR deposit rates (excluding ‘call deposits’), annual interest rate |
9,7 – 11,4 |
8,4 – 10,2 |
8,4 – 9,1 |
8,0 – 8,4 |
Foreign currency deposit rates (excluding ‘call deposits’), annual interest rate |
Up to 7% |
Up to 7% |
Up to 7% |
Up to 7% |
Other financial tools, such as shares, bonds, mutual investment funds are not yet attractive enough for the population because they are more risky, frequently less liquid and less familiar, although they could be the highest-yield investments if a proper investment strategy is pursued. In addition, while Russian stock market has already suffered a crisis, Russian RE market hasn’t yet had such a stressful negative experience, which could result in the loss of all, or the most part of, investments.
Budget subsidies for housing purchase
Budget subsidies for housing purchase in 2006-2007 were allocated mainly within the framework of the implementation of two state-programs - “Discharge of state liabilities for providing housing to certain categories of citizens, as envisaged by federal legislation”, and “Providing housing to young families”, both of which come under the federal target program “Housing” for 2002-2010.
In 2006 1.1% of total transactions in the housing market were completed with the help of federal subsidies, and in 2007 this figure grew up further, although the mentioned scope of incentives for greater demand didn’t seriously affect the dynamics of prices in the housing market.
Balance between housing demand and supply
According to the Federal Registration Service of the Russian Federation, in 2005 2.2 million sale transactions of housing were registered, and 3.6% of them were closed with the help of mortgages. In 2006 the turnover in the housing market grew up by 9% and 2.4 million transactions were registered, of which 332,000 transactions were registered in the primary housing market, and 2.07 million – in the secondary market. In the first half of 2007 the share of transactions based on debt finance grew further and amounted to 14%.
At the same time, the housing supply in the market was considerably lower than demand and less than 70% of demand was satisfied in 2006-2007, according to IUE assessments.
At the same time, housing production per 1 million RUR of actual annual household incomes (in 2006 prices) in 2007 was 2.8m2 against 3.5m2 in 1999 (Figure 6). This reduction demonstrates that unsatisfied demand for housing has grown up, because housing construction volumes fail to match the growing capacity of population to purchase housing.
Figure 6. Housing production in Russia per 1 million RUR of actual household incomes per year (in 2006 prices)
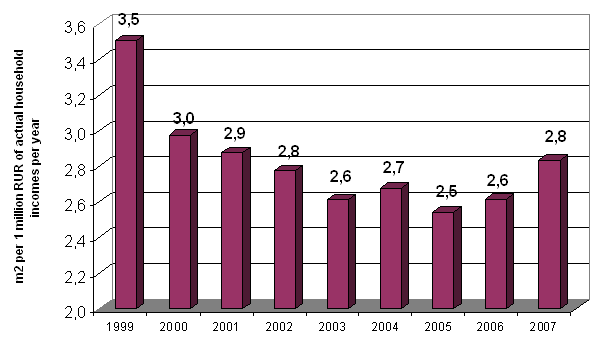
Source: IUE computations based on the data obtained from Rosstat.
Housing affordability[5]
Housing affordability ratio (housing price to household income ratio) is widely used in international practices for the assessment of housing affordability. It’s computed as a ratio of median housing cost to median household income per annum. The resulting figure corresponds to the number of years which a household needs to save enough money for purchasing an apartment, proceeding from the assumption that total household income is saved for housing purchase.
Taking into account the limited statistic available within the framework of the federal target program “Housing”, this ratio is computed as an average market price of a standard apartment of 54 square meters to an average total annual income of a family of 3.[6]
It’s worth noting, that prior to the economic collapse of 1998 a family of 3 had to save within 4.9 years all its cash incomes in order to buy a standard housing at an average price, while after the collapse this period expanded up to 7.3 years and more. After 1999 this indicator registered permanent downward trend (Figure 7) over several years, which was definitely positive dynamics.
In 2006, as a result of housing price growth, the rate of which exceeded the rate of growth of household incomes, the housing affordability ratio grew up to approximately 4.7 years, and later, in 2007 – up to 5.3. It should be noted that the federal target program “Housing” envisages that by 2010 the target value of this indicator will be 3 years.
This indicator characterizes only one side of housing affordability: the ratio between prices in the housing market and the level of household incomes. From this point of view, the housing affordability ratio which doesn’t exceed 3-5 years is internationally recognized as a normal practice[7]. In 2007 in 35 RF Regions the housing affordability ratio met these brackets, and in 5 regions with population less than 2% of total population household had to save money for housing purchase over a period of less than 3 years. In 39 regions with 50.5% of total RF population, the average affordability ratio exceeded 5 years. Figure 8 reflects the distribution (%) of the RF population by housing affordability ratio (which falls into the above-mentioned ranges).
Figure 7. Ratio of housing affordability in Russia, 1998-2007.
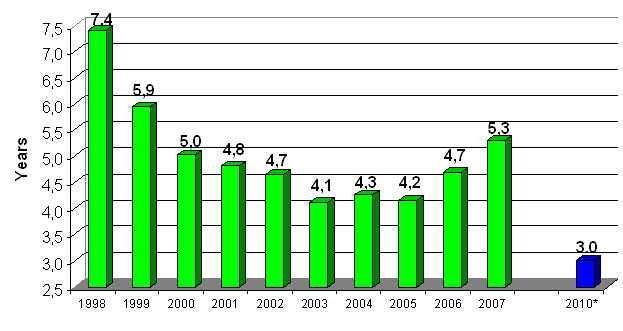 *Note: for 2010 – target indicator
set by the federal target program “Housing”
*Note: for 2010 – target indicator
set by the federal target program “Housing”
Source: 1998-2007 – IUE computations based on the data obtained from Rosstat.
Figure 8. Distribution of the RF constituent entities’ population by various housing affordability ratio (within the mentioned ranges) in 2007
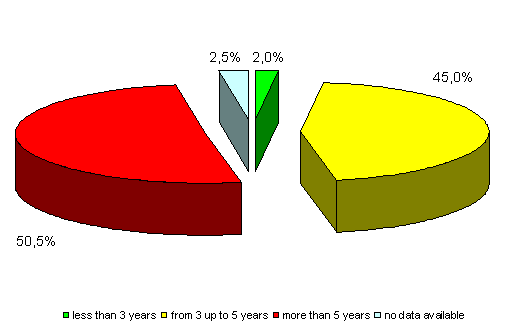
Source: IUE computations based on the data obtained from Rosstat.
It’s worth noting that the differences between federal districts (Okrugs) became smaller and there is a trend towards the leveling of average housing affordability ratios: in 2007 the difference between the federal districts with maximum ratio and those with minimum ratio was 46%, while in 1998 it was 94%. It means that differences in housing affordability in federal districts are gradually decreased. However, this positive trend slowed down in 2006.
In Europe this indicator varies on the average from 3-4 years up to 5-6 years. In some CIS countries it amounts to 7 years (Figure 9). In USA, just like in Russia, regional differences, as far as this indicator is concerned, are significant: in 2006 the smallest indicator was registered in Fort Wayne – 2 years, and the largest – in Los Angeles (11.4 years).
Figure 9. Housing affordability ratio in various countries (ratio between the housing price and household incomes)
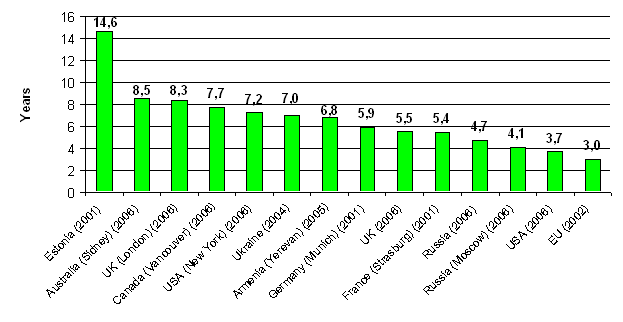
Source: IUE, UN Habitat, 3rd Annual Demographia International Housing Affordability Survey.
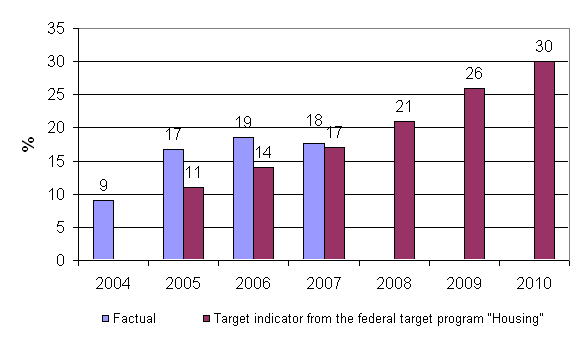
The federal target program “Housing” for estimating uses the indicator “proportion of households capable of purchasing housing, which meets the housing space requirement standards, by using their own funds or via borrowing”.
This indicator allows to precisely and comprehensively evaluate the affordability of housing by using own funds or via borrowing on the basis of the data about distribution of households by income levels and parameters of mortgage loans available in the market. Such an algorithm of computations is described in Addendum 9 to the federal target program “Housing”.
In 2004 this indicator equaled 9%, while by 2010, within the framework of the national project, it is expected to reach 30%, which means that 30% of households will have an opportunity to purchase standard housing with their own funds or via borrowing.
It should be noted, that due to the successful development of mortgage lending and easing of lending terms (decreasing of interest rates, extension of loan term, etc.) we observe considerable improvement in the general dynamics of this indicator, which in 2006 amounted to 19% (against 14% targeted by the federal program “Housing”). However, in 2007 it amounted to 18% (against targeted 17%).
Therefore, it can be said that development of mortgage lending increased the chances to buy housing and facilitated the growth of the number of households which can purchase housing in the market with their own funds in spite of worsened prices to current incomes ratio.
Much to our regret, this indicator cannot be easily compared across countries. On the average, in the countries with well-developed housing market this indicator, most likely, varies within the ranges of 40-60%. For example, the drop of this indicator in the UK from 46% (in late 80ies) down to 37% by 2002 caused much concern and gave rise to discussions about comprehensive measures needed to improve the situation and increase housing affordability[8].
Figure 10. Share of households able to buy dwelling using savings and mortgages
Note: 2004-2007 – computations by IUE. Average size of housing – 54 sq.m; LTV=70%; payments to income ratio – 30% (2004), 35%(2005-2007); loan term and interest rate in 2004 – 15 years and 15% accordingly (estimated figures), in 2005 – 16.8 years and 14.6% (data about a typical average borrower submitted by the Agency for Residential Mortgage Lending), in 2006 – 15.2 years and 13.7% (according to the Central Bank of RF), in 2007 – 16.6 years and 12.6% (according to the CB RF).
2008-2010 - forecast, according to the federal target program “Housing”. Average housing space – 54 sq.m; LTV=70%; payments to income ratio – 30%; loan term – 15 years; interest rate – 10.5% (2008), 9.8% (2009), 9.1% (2010).
Source: Rosstat, Agency for Residential Mortgage Lending, IUE, Federal Target Program “Housing”.
Stylized facts of the housing market development in Russian cities in mid-term perspective
At present housing mobility in Russia is very low. Extreme isolation of housing markets puts constraints on spatial migration. Moreover, there are no official statistics about housing markets in cities. For the purposes of analyzing the situation and finding out whether there is a ‘price bubble’ in the market, we’ll rely on the data obtained from RE market analysts[9].
In 2005-2007 housing markets of Russia cities went through yet another price growth cycle, as a result of which prices doubled, or even tripled (grew 2.6-3.4- fold). According to the data for the past 3 years all analyzed cities[10] can be divided into two groups[11]:
1) cities and towns where nominal housing prices grew more than 3-fold: Tver, Yaroslavl, Perm, Novosibirsk, Ulyanovsk;
2) cities and towns where nominal prices grew 2.5-3-fold: Yekaterinburg, St. Petersburg, Krasnodar, Izhevsk, Moscow and the Moscow countryside towns, Rostov-on-Don, Kransoyarsk, Ufa.
Growth was a common phenomenon for all cities and towns, but it wasn’t synchronized: in the first calendar year (2005) the growth varied between 9% (St. Petersburg) up to 55% (Yaroslavl), over two years (2005-2006) it varied between 46% (Krasnoyarsk) up to 211% (Yaroslavl), and over three years (2005-2007) it varied between 161% (Ufa) up to 238% (Tver). Therefore, for the purposes of finding out stylized facts of price growth common for various cities it’s necessary to analyze extended time series.
Analysis of data contained in Table 2 and in Figure 11, which reflects the situation in Moscow, as well as data in Figure 12, which describes price dynamics in other cities, allows us to arrive at a conclusion that over the past 16 years of Russia’s market modern history the dynamics of housing prices evidently passed through two stages. The first stage (from June 1990 till June 2000) continued for 10 years in Moscow and for 8-9 years in other cities. The second stage has been continuing for more than 7 years in Moscow and for more than 6 years in other cities. During the first decade of legal existence of RE market one was able to see the take off and the leap of prices, transition towards stabilization, followed by the 1998-1999 crisis. In mid 2000, when the housing market hit the bottom after the August crisis, the first stage of unstable, wobbling development of the market came to an end. Over the next 7 years, up till now, housing prices in the market have been constantly growing, although rate of growth tended to change for a brief span of time (and sometimes even stabilized).
Table 2. Housing market development stages and their duration in various Russian regions in 1990-2007
Stage |
Moscow |
St.Petersburg |
Moscow Oblast |
take off and leap |
June 1990 – March 1995 |
December 1991 – May 1994 |
… |
Stabilization |
April 1995 – August 1998 * |
June 1994 – October 1998 ** |
December 1996 – July 1998 *** |
Crisis |
September 1998 – June 2000 |
November 1998 – October 2000 |
August 1998 – December 1999 |
Post-crisis recovery |
July 2000 – December 2001 |
November 2000 – January 2003 |
January 2000 – February 2002 |
Stabilization-2002 |
January 2002 – August 2002 |
– |
March 2002 – July 2002 |
Jubilee growth**** |
– |
February 2003 – August 2003 |
– |
«Oil» generated growth |
September 2002 – June 2004 |
August 2003 – July 2004 |
August 2002 – September 2004 |
Stabilization-2004 |
July 2004 – July 2005 |
July 2004 – July 2005 *** |
October 2004 –September 2005 |
«Mortgage and oil» generated growth |
July 2005 – June 2006 |
August 2005 – December 2006 |
October 2005 – September 2006 |
Moving towards stabilization |
July 2006 – December 2006 |
- |
September 2006 – December 2006 |
Stabilization -2007 |
December 2006 – October 2007 |
December 2006 – March 2007 |
December 2006 – October 2007 |
Start of new growth |
October 2007 – December 2007 |
March 2007 – December 2007 |
October 2007 – December 2007 |
Stage |
Novosibirsk |
Yekaterinburg |
Tver |
take off and leap |
… |
December 1991 – June 1994 |
December 1991 – June 1994 |
Moving towards stabilization |
… |
July 1994 – July 1998 |
- |
Stabilization-1997 |
December 1996 – July 1998 *** |
- |
July 1994 – September 1998 |
Crisis |
July 1998 – December 2000 |
August 1998 – June 2000 |
October 1998 – September 2000 |
Post-crisis recovery |
January 2001 – December 2001 |
July 2000 – December 2001 |
October 2000 – April 2002 |
Stabilization-2002 |
December 2001 – January 2003 |
January 2002 – August 2003 |
May 2002 – December 2003 |
«Oil» generated growth |
January 2003 – March 2005 |
September 2003 – December 2004 |
January 2004 – July 2004 |
Stabilization-2004-2005 |
March 2005 – June 2005 |
January 2005 – March 2005 |
August 2004 – March 2005 |
«Mortgage and oil» generated growth |
July 2005 – June 2007 |
April 2005 – December 2006 |
April 2005 – December 2006 |
Moving towards stabilization |
June 2007 – September 2007 |
- |
- |
Stabilization-2007 |
- |
December 2006 – December 2007 |
June 2007 – September 2007 |
Start of new growth |
September 2007 – December 2007 |
– |
September 2007 – December 2007 |
Stage |
Rostov-on-Don |
Perm |
Ulyanovsk |
Stabilization-2002 |
December 2001 – May 2003 |
December 2001 – November 2003 |
December 2001 – March 2003 |
«Oil» generated growth |
June 2003 – May 2004 |
December 2003 – February 2005 |
March 2003 – December 2004 |
Stabilization-2004-2005 |
June 2004 – August 2005 |
February 2005 – August 2005 |
December 2004 – July 2006 |
«Mortgage and oil» generated growth |
August 2005 – March 2007 |
August 2005 – May 2007 |
July 2006 – April 2007 |
Stabilization-2007 |
March 2007 – August 2007 |
May 2007 – August 2007 |
April 2007 – December 2007 |
Start of new growth |
August 2007 – December 2007 |
August 2007 – December 2007 |
- |
Stage |
Izhevsk |
Yaroslavl |
Krasnodar |
Stabilization-2002 |
December 2001 – May 2004 |
December 2001 – December 2002 |
October 2002 – March 2004 |
«Oil» generated growth |
May 2004 – June 2005 |
December 2002 – July 2003 |
March 2004 – February 2005 |
Stabilization-2003-2005 |
June 2005 – January 2006 |
July 2003 – December 2004 |
February 2005 – November 2005 |
«Mortgage and oil» generated growth |
January 2006 – April 2007 |
December 2004 – December 2006 |
November 2005 – May 2007 |
Stabilization-2007 |
April 2007 – December 2007 |
December 2006 – September 2007 |
May 2007 – July 2007 |
Start of new growth |
- |
September 2007 – December 2007 |
July 2007 – December 2007 |
* – wobbling stabilization («with rolling-back»);
** – asymptotic stabilization («with crawling effect»);
*** – stabilization (with corrections);
**** – only St.Petersburg went through this stage during the preparations for the 300th city anniversary celebrations, when housing prices sky-rocketed beyond the expected maximums.
Figure 11. Housing market development stages, Moscow
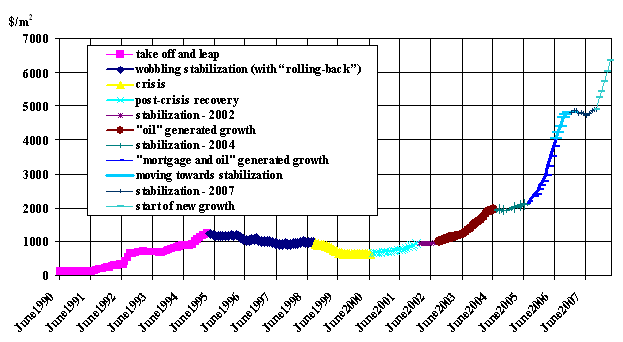
Figure 12. Housing price indices in Moscow and other Russian cities by December 2001

Meanwhile, all other cities went through more or less similar stages, just like Moscow and the Moscow countryside towns did: take off and leap of prices (up to 1995), stabilization (up to 1997), crisis (up to 2000), post-crisis recovery (till 2001, stabilization-2002, “oil generated” growth, stabilization-2004, “mortgage and oil generated” growth (2005-2006), moving towards stabilization (end of 2006), stabilization-2007, start of new growth.
The following specific features characterize these cities and towns:
- asynchronized start and end of separate stages;
- certain differences in the unfolding of events during concrete stages.
The price dynamics graph presented in the Appendix allows us to identify one stylized fact, common for all surveyed cities: since 2001 prices never seized to grow and there were neither price drops, nor crises.
Another stylized fact of long-term evolution of prices in regional markets was brought to life by asynchronized development of these markets: in the early stages of growth due to the fact that this growth starts in the regions a bit later than in Moscow and St. Petersburg price trends split apart (the gap between the lines in the graph widens), while at the end of the ‘growth’ stage, when movement towards stabilization begins – trends are gradually consolidating (the gap narrows). The first phenomenon was observed in 1990-1995, 1998-1999 (when prices dropped) and can be seen in Figure 12 (summer-autumn 2003), in autumn 2005, and in the end of 2007; the second phenomenon was observed in 1996-1997, in the end of 2000-beginning of 2001, in early 2005 and in the end of 2006. During the periods of maximum stratification of market the ratio between maximum and minimum indices of growth varied (in June 2004 and in October 2006) between 1.8 and 1.9. While during the periods of maximum market consolidation – in June 2005 and in December 2007 – it was within the ranges of 1.2-1.3.
The end of 2007 saw yet another consolidation of trends which testified to the start of a new spiral of growth of housing prices in Russian cities. The data presented demonstrates that the long-term growth of prices in fledging markets is undulating, rather than steady. It’s accompanied by cyclic fluctuations of monthly rates of growth – from zero up to 10-12%, and the frequency of fluctuations varies from 2.5 to 3 years. Within one cycle prices start to grow, reach the ceiling rate of growth, pass it, and then once again stabilize. And within one cycle only prices register a 2.5-3 fold growth.
Such price pattern is, first of all, the consequence of one phenomenon common to fledging markets – total effective demand there considerably exceeds supply.
Forecast of housing price dynamics
Economic and mathematical models of behavior of fluctuating systems[12] were applied in the Russian cities for a long time for the purposes of forecasting the trend of prices in the housing market, and until 2001 (including the stage of post-crisis market recovery) such models ensured the high accuracy of forecasts.
Over the past 6-7 years all Russian cities witnessed permanent housing price boom. At first this fact was perceived as a hurdle for economic and mathematical modeling in the absence of market fluctuations. Forecasts (which were frequently unsuccessful) were made on the basis of analysis of separate factors and their impact on prices. However, steady growth of prices in the second stage of the housing market development in Russia, especially the price boom in 2003 and 2005, were not forecasted by the models, and the consequences of these stages were assessed by us as prerequisites for formation and burst of “price bubble” in the housing market of Moscow. By comparison, British analysts during the same period of time viewed the “bubble” scenario as the most probable one for the housing markets of the UK, USA, Canada, Australia and other countries. In the summer of 2006, a hypothesis was formulated, according to which the RE market in Russia followed the stable growth pattern of the whole national economy on a long-term basis.[13] The method of “unharmonious expansion of price trend”[14] allows to make in December- January a mid-term forecast (for 2007-2008) price dynamics in Moscow, Moscow Oblast and in 8 other cities[15].
Mathematical forecast-model comprises the following equations[16]:
Y = y + Δy2 + Δy3 + Δy4 + …. + Δyn, (1)
y1 = a3 x3 + a2x2 + a1x + a0 , (2)
Δy1 ![]() , (3)
, (3)
Δy2 = ![]() , (4)
, (4)
Δy4 = ![]() , (5)
, (5)
……………………………………… , (n)
Y – forecasted cost of 1m2 of housing in month “x”, RUR ($)/square meters;
y1 - basic trend equation (long-term forecast), RUR ($)/square meters;
Δy1 – forecasted growth of average price of 1 m2 of housing in month “x” against the
basic trend, RUR ($)/square meters;
Δy2 - forecasted growth of average price of 1 m2 of housing in month “x” against the
second order trend, RUR ($)/square meters;
Δy3– forecasted growth of average price of 1 m2 of housing in month “x” against the
third order trend, RUR ($)/square meters;
Δyn– forecasted growth of average price of 1 m2 of housing in month “x” against the
“n” order trend, RUR ($)/square meters;
a i , b i , c i , d i (i=1..5) – equations’ coefficients (of various order trends), which approximate factual data.
Coefficients are evaluated on the basis of actual data via using the least-squares method.
Backward forecasts, based on this model, demonstrated that in the beginning of 2007 the Moscow region would enter the stage of stable prices with possible fluctuations in the range of +/- 5%, and that this stage could continue at least till early 2008, but after that a new stage of faster price rate growth will follow (see Figure 13).
Figure 13. Forecast of market housing price dynamics in Moscow, in 2008-2009
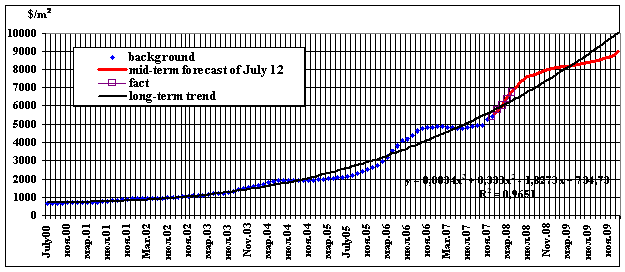
The quality of these forecasts is good enough: in terms of quantities the forecasts were pretty accurate, although the margin of error for Perm, Novosibirsk and St. Petersburg for half-year exceeded 10%. In Moscow, the Moscow Oblast, Yekaterinburg and Tver the forecasts for 10 months proved to be very precise, although the last 2-3 months saw a new price boom the rate of which was higher than the forecasted one. The reasons behind such a phenomenon are listed below.
The first, and the main reason lies in the sphere of politics: the country leadership managed to avoid confrontation between political structures, between the authorities and businessmen during election campaigns. As a result there was no significant outflow of capitals from the country and deferred demand for housing was realized, which was supported by considerable growth of real incomes and savings (real wages in 2007 grew up by 16% against 13.4% in 2006).
The second, macroeconomic reason was a considerable growth of oil prices in the world in the end of 2007, unbelievable growth rate of investment and inflow of capitals into the Russian economy.
The third reason goes with the above-mentioned and consists of the continuing strengthening of Russian rubles, freezing mortgage affordability a reaction to the mortgage crisis in the US, surge of inflation in autumn 2007, which, in their turn, created a new wave of mistrust in the Russian financial system. The latter served as an additional incentive for high-income groups of population to spend their money in the RE market.
As a result of all this, the stabilization stage in Moscow and the Moscow Oblast was 10 months, which is 3-4 months shorter than forecasted, while in other cities it continued for 4-8 months and the incremental growth of price was slightly higher by the end of the year. However, the forecasted pattern of price dynamics has proved to be correct everywhere.
The obtained results made it possible to apply the model discussed above for forecasting price dynamics in Moscow and other Russian cities in 2008 - 2009 (see Table 4)
Table 4. Forecast of price dynamics in Russian cities in 2008-2009
City (region) |
Price growth indices |
||||
2007/2006 |
2008/2007 |
2009/2008 |
2008/2006 |
2009/2006 |
|
Ulyanovsk |
1,45 |
2,01 |
1,28 |
2,91 |
3,72 |
Novosibirsk |
1,417 |
1,70 |
1,45 |
2,41 |
3,50 |
Perm |
1,58 |
1,64 |
1,31 |
2,59 |
3,39 |
Tver |
1,34 |
1,43 |
1,51 |
1,91 |
2,88 |
St.Petersburg |
1,23 |
1,84 |
1,22 |
2,39 |
2,80 |
Yekaterinburg |
1,083 |
1,80 |
1,30 |
1,95 |
2,53 |
Rostov-on-Don |
1,28 |
1,69 |
1,17 |
2,17 |
2,53 |
Yaroslavl |
1,09 |
1,79 |
1,17 |
1,65 |
1,94 |
Moscow |
1,124 |
1,48 |
1,09 |
1,67 |
1,82 |
Izhevsk |
1,015 |
1,64 |
1,05 |
1,66 |
1,74 |
Moscow Oblast |
1,006 |
1,68 |
1,001 |
1,69 |
1,69 |
According to the forecast, in 2008 growth of prices in Moscow will continue, and by December the prices will reach $7,500-8,500/m2 (45-50% growth over the year, and 80-85% growth against December 2006). In the Moscow Oblast the prices might reach $4,000-5,000/m2 (65-70% growth over the year, and similar growth against December 2006). Price dynamics in early 2008 allow us to say with high degree of probability that events will be evolving in accordance with the above-mentioned scenario. Thus, in January there was 5% growth of prices against the background of a reduced number of exposed apartments, which signifies the excess of demand over supply in the Moscow housing market[17].
Forecasts made for other regions demonstrate that the housing price situation there will evolve in much similar way. In 2008 prices will grow by 40-45% in Tver, by 60-70% - in Perm, Izhevsk, Rostov-on-Don, Novosibirsk; by 80-85% - in St. Petersburg, Yaroslavl, Yekaterinburg, and in Ulyanovsk – by more than 100%.
Over three years (2007-2009) prices in the Moscow Oblast, Izhevsk, Moscow, Yaroslavl are expected to grow by 1.7-1.9 times; in Yekaterinburg, Rostov-on-Don, St. Petersburg – by 2.5-2.8 times; in Perm and Novosibirsk – by 3.4-3.5 times, and in Ulyanovsk – by 3.7 times.
Thereafter (probably, after 2010-2011), provided that construction volumes and housing supply grow up significantly, we forecast a slow-down of price long-term growth rates.
The forecasted price dynamics will experience the influence of numerous groups of factors, both stimulating the price growth, and obstructing it. These factors can be grouped into two categories: external factors outside the RE market (political, macroeconomic, factors of interaction with adjacent markets) and internal factors inside the RE market (progress of the national priority program “Affordable Housing”, growing housing mobility of population, interaction with adjacent segments of the RE market) (see Table 5).
Table 5. Balance of factors determining mid-term dynamics of housing prices
Factor categories |
Factor groups |
Factor impact on prices |
|
Growth |
Drop |
||
External factors |
Political |
Election campaign: extra financing of presidential campaign, higher effective demand due to larger fees of political technologists, mass media staff, show business representatives |
Certain risk of higher social tension in the period of presidential election campaign, replacement of governors in several regions, government formation |
Macroeconomic |
Further growth of GDP (although at lower rate – 6-6.5% against 8.1% in 2007), growth in budget spending and actual household income level. Continued growth of capital inflow, primarily due to corporate borrowing (in 2005 net inflow of the latter for the first time ever was positive - $0.1billion), in 2006 it amounted to $42 billion and in 2007 – to $82.3billion. Continued growth of oil prices (according to some forecasts, up to $200 per barrel). Process of Russia’s admission to the WTO, as well as low political risks facilitate the inflow of capitals from foreign companies, banks and funds to Russia, especially against the background of signs of economic recession in the United States. Continued strengthening of Ruble and higher rate of inflation. |
GDP growth rate declined, which impaired authorities’ ability to address social and economic problems and to maintain the growth rate of household incomes. Further growth of capital flight volumes for the purposes of direct investment. Possible drop in the inflow of speculative capitals in the situation when attractiveness of financial facilities both in the US and Europe increases, provided residential mortgage crisis is defused. |
|
Factors of interaction with adjacent markets |
Fall in the world stock markets indices and signs of crisis in the RF stock market, including return of capitals via mutual funds, which facilitate the flow of investments to the RE market and cause the growth of prices of RE. |
RF stock market development, creation of various high yield financial tools, which contributes to free flow of capitals from the RE market to adjacent markets. Continued consumer boom, which implies reduced savings of population which could be used for housing purchase. Increased volume of defaults on consumer loans, which might entail additional banks’ liquidity problems and cause decline in the rate of growth of mortgage lending volumes. |
|
Domestic factors affecting the housing market |
Further development of the national project “Affordable Housing” |
Increased volume of state incentives and mortgage lending, first of all, in the new housing construction market. Maintaining current volumes, or reduction of volumes of housing supply in Moscow (against the background of certain increase in the volumes of new housing production – from 4.8 million sq.m in 2007, up to 5.0-5.3 million sq.m in 2008) due to the fact that almost 50% of housing space will be handed over to the municipality for its programs execution. |
Increased volumes of housing construction in the RF regions (nationwide in 2007 – 60.4 million sq.m, and in 2008 – not less than 72 million sq.m) and greater supply of housing in the primary market. Slowing down of rate of growth of mortgage transactions and reduction of proportion of mortgage transactions in the total number of housing sales due to accelerated growth of demand and depletion of supply, and due to the growth of bank interest rates by 1-2% (while the Agency for Residential Mortgage Lending plans to increase the volume of refinancing mortgage loans in 2008 up to 65 billion RUR). |
Increased residential mobility of population |
Inflow of buyers from far away regions to the Urals region, Volga region, Central and North-Western regions; from regions – to Moscow and Moscow countryside; from Moscow – to less expensive Moscow Oblast, which contributes to the growth of effective demand in Moscow and other regions. |
Outflow of low-income and moderate-income groups of population from Moscow to the near and more distant Moscow countryside, which results in the drop of effective demand in Moscow proper. Competitive supply of housing for high-income strata of population in St. Petersburg and Sochi, in the cities of middle and southern Europe, which results in the drop of effective demand in Moscow. |
|
Interaction with adjacent segments of RE market |
Continued accelerated growth of investments into retail and commercial RE construction, transportation and social infrastructure, which altogether increases the attractiveness of housing market. |
Flow of investments into commercial RE market (trade, offices, recreation sites, logistical complex facilities, techno-parks, etc.) against the background of drop of yield of housing construction. |
|
Thus the balance of factors points at a strong upward trend in price dynamics of the housing supplied in the Russian cities and confirms the results of the mathematical modeling.
Conclusion
Complex analysis of the above-mentioned indicators testifies to the fact that the growth of housing prices in 2006-2007 was stimulated by the following factors:
§ Housing supply rate lagged behind the rate of growth of effective demand, which was caused by the growth of per capita cash incomes and the increased affordability of mortgage loans, not to mention other reasons;
§ Absence of alternative ways of investing cash for savings or extra earnings.
By far and large, the housing market in 2007 registered an obvious, and practically nationwide slow-down of the rate of price growth. With due account for the impact of macroeconomic factors, we can talk about an emergence of a number of cities and towns, which for the first time in their history registered the reduction of real-term prices (adjusted for inflation).
Mortgage lending facility, which was looked at as a main lever for increasing the housing affordability, was subjected to rigorous testing because of elements of crisis in the American economy. To a great extent its future depends on the general economic situation in Russia, which includes its ability to withstand a negative pressure from outside. At the same time, the analysis of the market of residential mortgage-backed transactions over the past couple of years demonstrated that the behavior of the mortgage market depends on the general situation in the housing market much more, than on the terms of lending. Given stable prices and a considerable volume of housing supply, even if demand is shrinking, we witness the increase of the volume of mortgage transactions and, especially, the growth of the share of such transactions. At the same time, an increased demand, reduced supply and high rate of price growth lead to slow-down of rate of growth of the volume of such transactions and to reduction of their share in the market.
In the end of 2007 the housing market of the Moscow region entered a new stage of development – the increasing rate of price growth. Forecast for 2008 for Moscow and the Moscow Oblast anticipates a considerable price growth: annual growth of prices will amount to 45-50% and 65-70% accordingly, while in the other cities it will amount to 45-50% (Tver), 65-70% (Perm, Rostov-on-Don), Izhevsk), 70-85% (Novosibirsk, St. Petersburg, Yekaterinburg) and 100% (Ulyanovsk). No housing price drop is forecasted for any surveyed city or town.
Over three years (2007-2009) prices will grow up by 1.7-1.8 times in Moscow, the Moscow countryside, Izhevsk; by 2.5-2.9 times – in St. Petersburg, Yekaterinburg, Tver, Rostov; by 3.4-3.5 times – in Novosibirsk and Perm, and by 3.7 times in Ulyanovsk.
The long-term forecast (for 10-15 years) envisages stable growth of prices (dollar-denominated nominal prices) and a gradually increasing annual rate of growth of 25-30% with monthly rates varying from zero up to 8-12%.
Therefore, the natural transition to the stage of growth of prices in 2008 and the growth forecasted for 10-15 years can be explained by disastrous disparity between low volumes of housing construction and supply and high volume of effective demand, which can be interpreted as an absence of “price bubble” in the housing market.
[1] Approved by Resolution #595 of the Government of the RF, dated June 20, 1993.
[2] Presidential Decree #431, dated March 29, 1996.
[3] With amendments approved by the RF Government Resolution #865, dated December 31, 2005.
[4] See: Loans Refinancing: more funds for mortgage lending//Information&Analytics magazine “Perviy Ipotechniy”. 2006, #0 (in Russian).
[5] Hereinafter average housing prices per annum are used for the computation of the housing affordability indices .
[6] It should be noted that the margin of error explained by the application of data about average household income, rather than median average income in the present-day Russia, is rather big and results in the overstating of the housing affordability in Russia when it’s compared with other countries.
[7] See: 3rd Annual Demographia International Housing Affordability Survey: 2007 (http://www.demographia.com/dhi-ix2005q3.pdf).
[8] Barker K. Review of Housing Supply. Final report: Recommendations – London, HMSO, 2004 – www.barkerreview.org.uk
[9] An analyst of the RE market certified by the Russian Guild of Realtors should regularly monitor the housing market prices in his city in accordance with the common methodology, therefore his data is considered comparable.
[10] Comparable data were available for the following cities: Moscow (since June 1990), St. Petersburg (since December 1991), towns located in the Moscow Oblast (since December 1996), Novosibirsk (since December 1996), Yekaterinburg (since December 1991), Tver (since December 1991), Rostov-on-Don (since December 2001), Perm (since December 2001), Ulyanovsk (since December 2001), Izhevsk (since December 2001), Yaroslavl (since December 2001), Krasnodar (since October 2002).
[11] Petropavlovsk-Kamchatsky stays aside: over 2005-2007 prices there grew up less than 1.9 times, which can be explained by the city’s remoteness from most other cities and towns included in the sampling.
[12] Econometric analysis and forecast of housing prices in the Russian cities/ G.M.Sternik// Materials of the ENHR conference on the economics of the housing market, Vienna, February 1997.
[13] Does RE market evolve in cycles?/ G.M.Sternik – www.realtymarket.ru, June 2006.
[14] Unharmonious expansion of price dynamics of the housing market of Moscow/ G.M.Sternik, A.N.Krasnopolskaya.- www.realtymarket.ru, July 2006.
[15] Prices in the housing markets of the Russian cities in 1990-2006: analysis and forecast/G.M.Sternik and his group of analysts. - www.realtymarket.ru, January 2006.
[16] What’s going on in the housing market of Moscow? Macroeconomic analysis (Report at the Analytical Conference of the Moscow Association of Realtors “RE market: status, trends and forecast” (August 30, 2007)/ G.M.Sternik, A.V.Pechenkina. - www.realtymarket.ru, August 2007.
[17] Unaffordable “light in the Moscow windows”/ Yu.Ignatyeva// Izvestia, February 29, 2008, p.1,7.